# nagios下用grafana绘图(二)
现在不需要安装elasticsearch了,所以省去了很多步骤.
使用如下工具:
graphite
grafana-3.1.1-1470047149.x86_64
graphios
部署环境:
Centos 6.5
python 2.6
nagios 4.1.1
# 一.安装graphite
1.关闭selinux
2.安装依赖工具
yum install epel-release -y
yum install bitmap bitmap-fonts-compat Django django-tagging fontconfig cairo python-devel python-memcached python-twisted  pycairo mod_python python-ldap python-simplejson memcached python-zope-interface mod_wsgi python-sqlite2  Django MySQL-python  -y
安装pytz
pip install pytz
carbon依赖Twisted,如果是python2.6,新版的Twisted不支持python2.6,需手动安装支持2.6的版本,这里用Twisted-15
wget https://pypi.python.org/packages/76/9a/ed7a9cabefd919c861249d39d11111d5d8fba2e8d0b2a1bce7ee8933a8fd/Twisted-15.0.0.tar.bz2#md5=f52bfe112a3aa33dd1d323c7c1e99f16
tar jxvf Twisted-15.0.0.tar.bz2
cd Twisted-15.0.0
python setup.py install
3.安装graphite
使用pip安装
pip install whisper
pip install carbon
pip install graphite-web
添加配置文件
cd /opt/graphite/conf/
cp carbon.conf.example carbon.conf
cp storage-schemas.conf.example storage-schemas.conf
cp graphite.wsgi.example graphite.wsgi
4.配置apache
cat /opt/graphite/examples/example-graphite-vhost.conf  >> /etc/httpd/conf/httpd.conf

vim /etc/httpd/conf/httpd.conf
添加
Listen 8081

修改端口为8081
<VirtualHost *:8081>

修改WSGISocketPrefix 为
WSGISocketPrefix /var/run/httpd/wsgi

初始化数据库
cd /opt/graphite/webapp/graphite/
cp local_settings.py.example local_settings.py
python manage.py syncdb
chown -R apache:apache /opt/graphite
5.启动graphite
/opt/graphite/bin/carbon-cache.py start
service  httpd restart
访问http://ip:8081 即可进入graphite
# 二.安装配置graphios
# 1.安装
git clone https://github.com/shawn-sterling/graphios.git
cd graphios
python setup.py install

mkdir -p /var/spool/nagios/graphios
chown nagios:nagios -R /var/spool/nagios
# 2.配置
安装完成后,会自动在/usr/local/nagios/etc/nagios.cfg中添加graphios的配置
注释掉这行,避免配置冲突
cfg_dir=/usr/local/nagios/etc/objects
手动添加command的配置
vim /usr/local/nagios/etc/objects/commands.cfg
define command {
        command_name    graphite_perf_host
        command_line    /bin/mv /var/spool/nagios/graphios/host-perfdata /var/spool/nagios/graphios/host-perfdata.$TIMET$
        }

define command {
        command_name    graphite_perf_service
        command_line    /bin/mv /var/spool/nagios/graphios/service-perfdata /var/spool/nagios/graphios/service-perfdata.$TIMET$
        }

在nagios对应的主机或服务中,添加 _graphiteprefix 值
如
define host {
    host_name                   gzimg110
    check_command               check_ping
    _graphiteprefix                ping
}
# 3.配置graphios
vim /etc/graphios/graphios.cfg
修改如下内容
debug = False
enable_carbon = True
sleep_max = 3
vim /usr/bin/graphios.py
将对应值修改为如下内容
config_file = '/etc/graphios/graphios.cfg'
debug = False
启动graphios
service graphios start
service nagios restart
可以查看日志,看是否正常
tail /usr/local/nagios/var/graphios.log
查看/opt/graphite/storage/whisper/下是否有对应的文件产生
# 三.安装配置grafana
# 1.安装
可以访问官网获取最新的版本
http://docs.grafana.org/
本次使用3.1.1
wget https://grafanarel.s3.amazonaws.com/builds/grafana-3.1.1-1470047149.x86_64.rpm

rpm -ivh grafana-3.1.1-1470047149.x86_64.rpm
# 2.配置
grafana默认使用3000端口
vim /etc/grafana/grafana.ini
开启如下选项
protocol = http
http_port = 3000
admin_user = admin
admin_password = admin
# 3.使用
启动grafana
service grafana-server start
打开浏览器,访问grafana
http://ip:3000
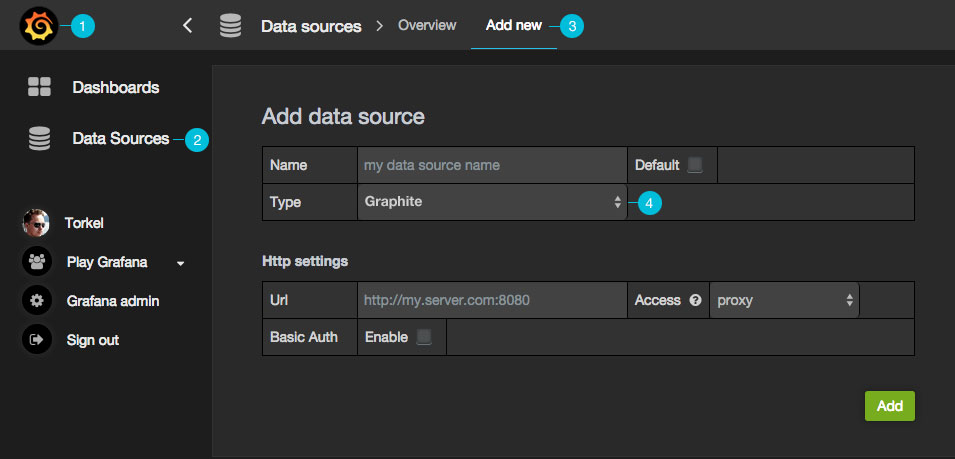
按如下步骤,添加graphite数据源
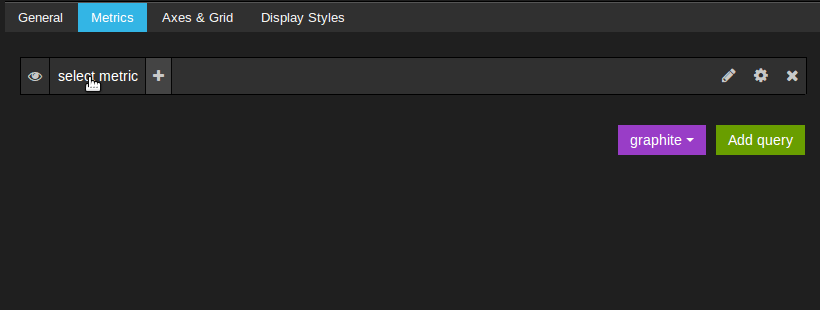
添加完成后,点开dashborads,即可添加对应的服务了.
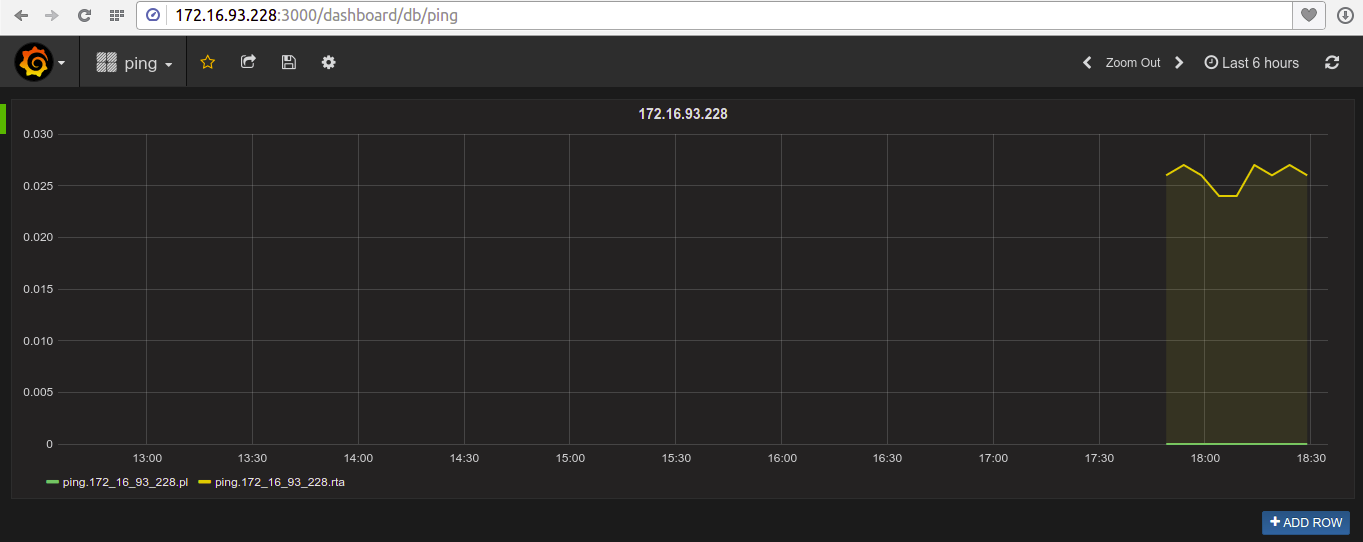
最终效果: